Closed loop
Each virtual user sends its next request after the previous response. Useful for interactive capacity behavior.
PERFORMANCE
Compare serving behavior with RPS, latency, TTFT, throughput, concurrency and success rate — then inspect charts and output artifacts.
LOAD CURVE
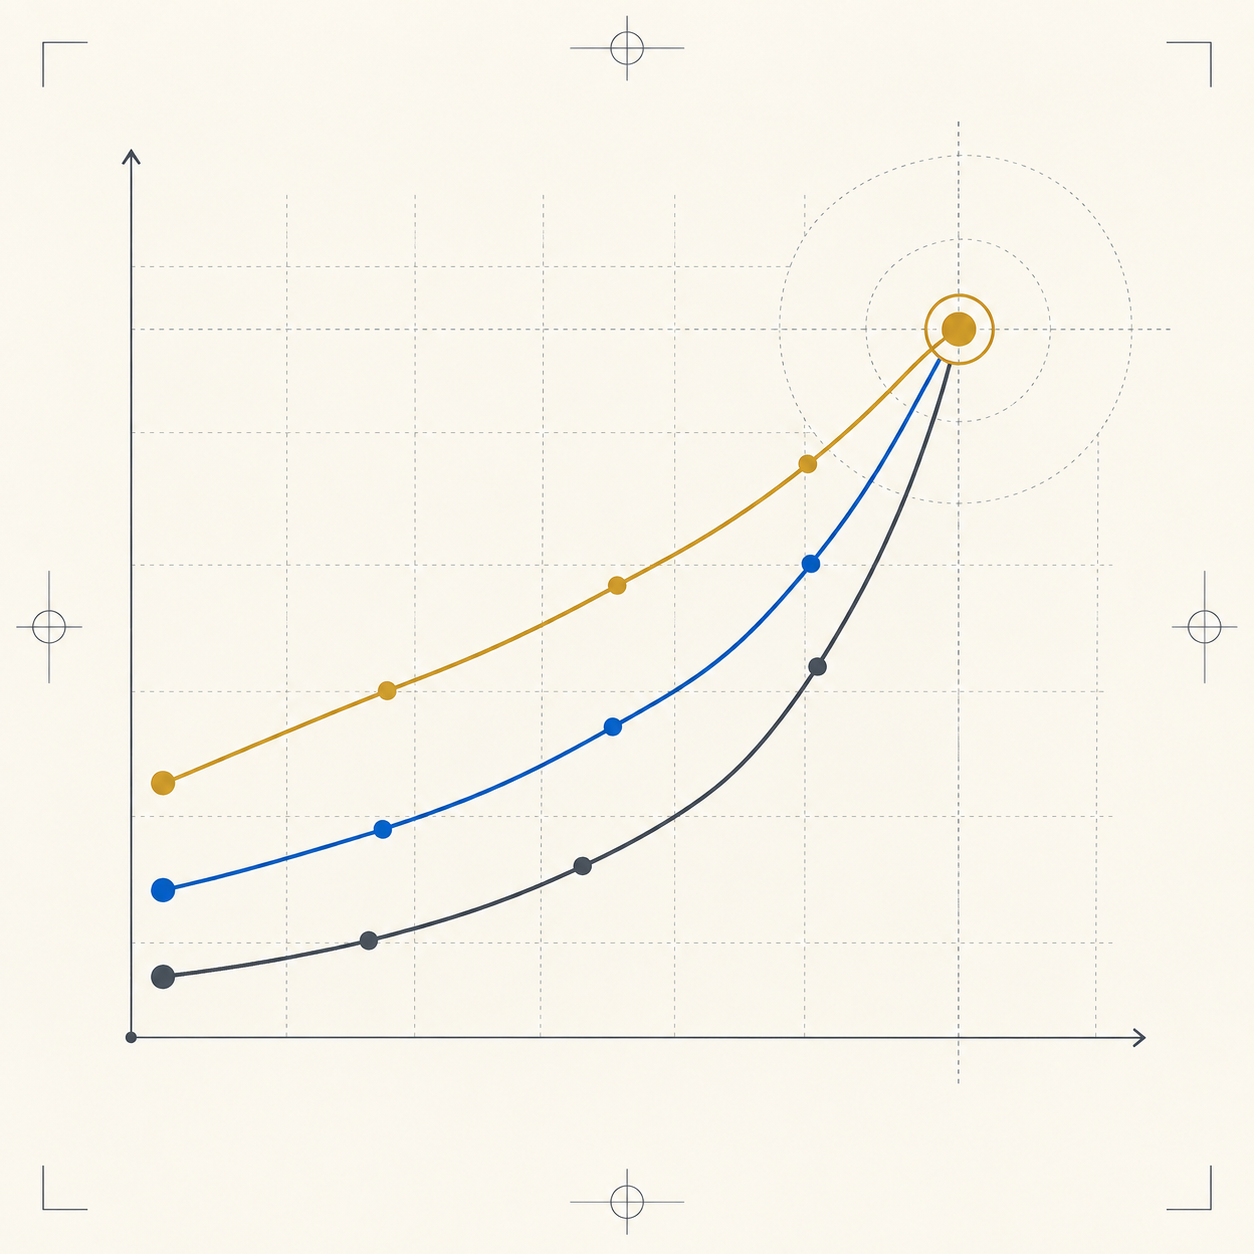
Keep testing until the bottleneck is reached
Beyond a single throughput number
Each virtual user sends its next request after the previous response. Useful for interactive capacity behavior.
Requests arrive at a target rate, independent of completion. Useful for arrival-pressure experiments.
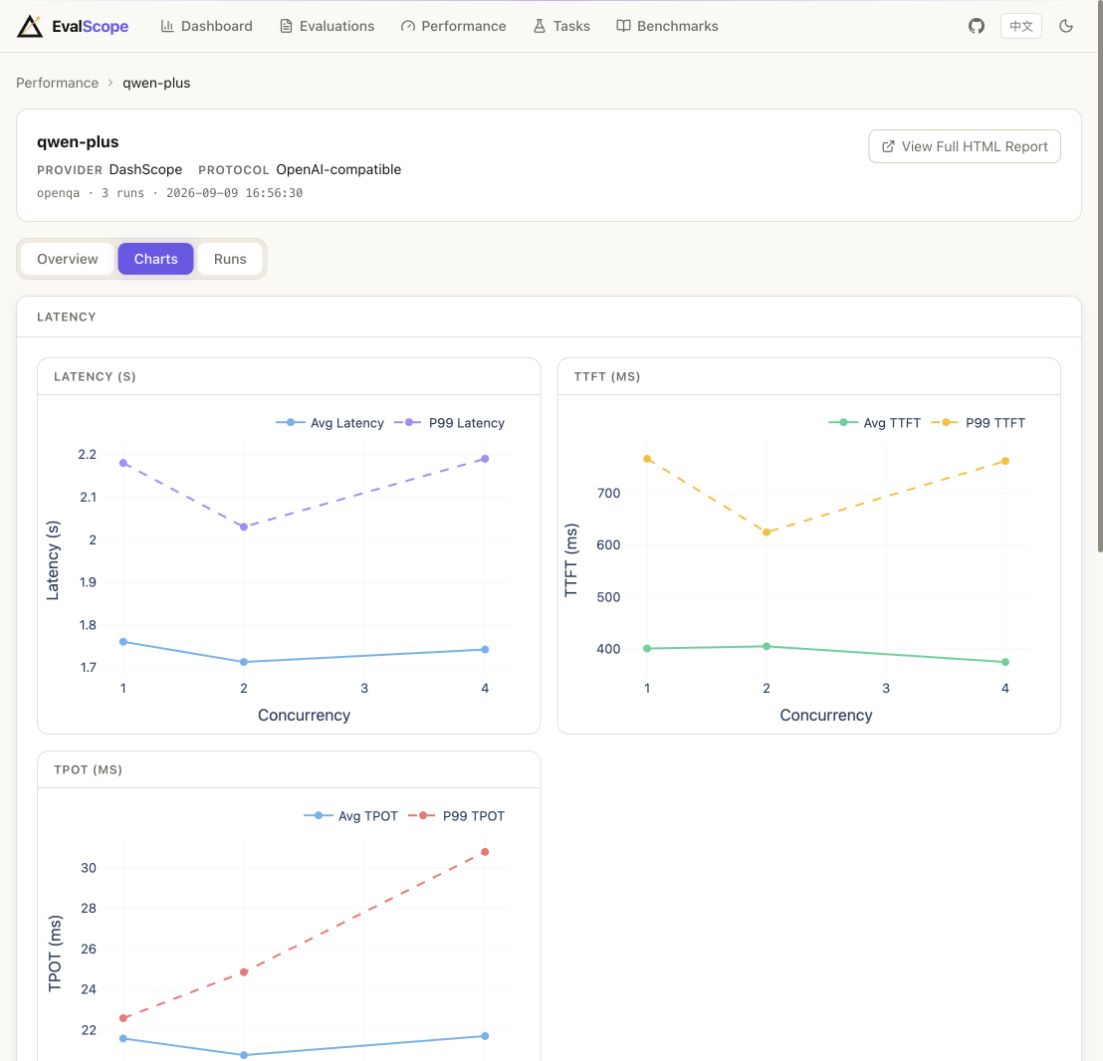
Same data · better insights
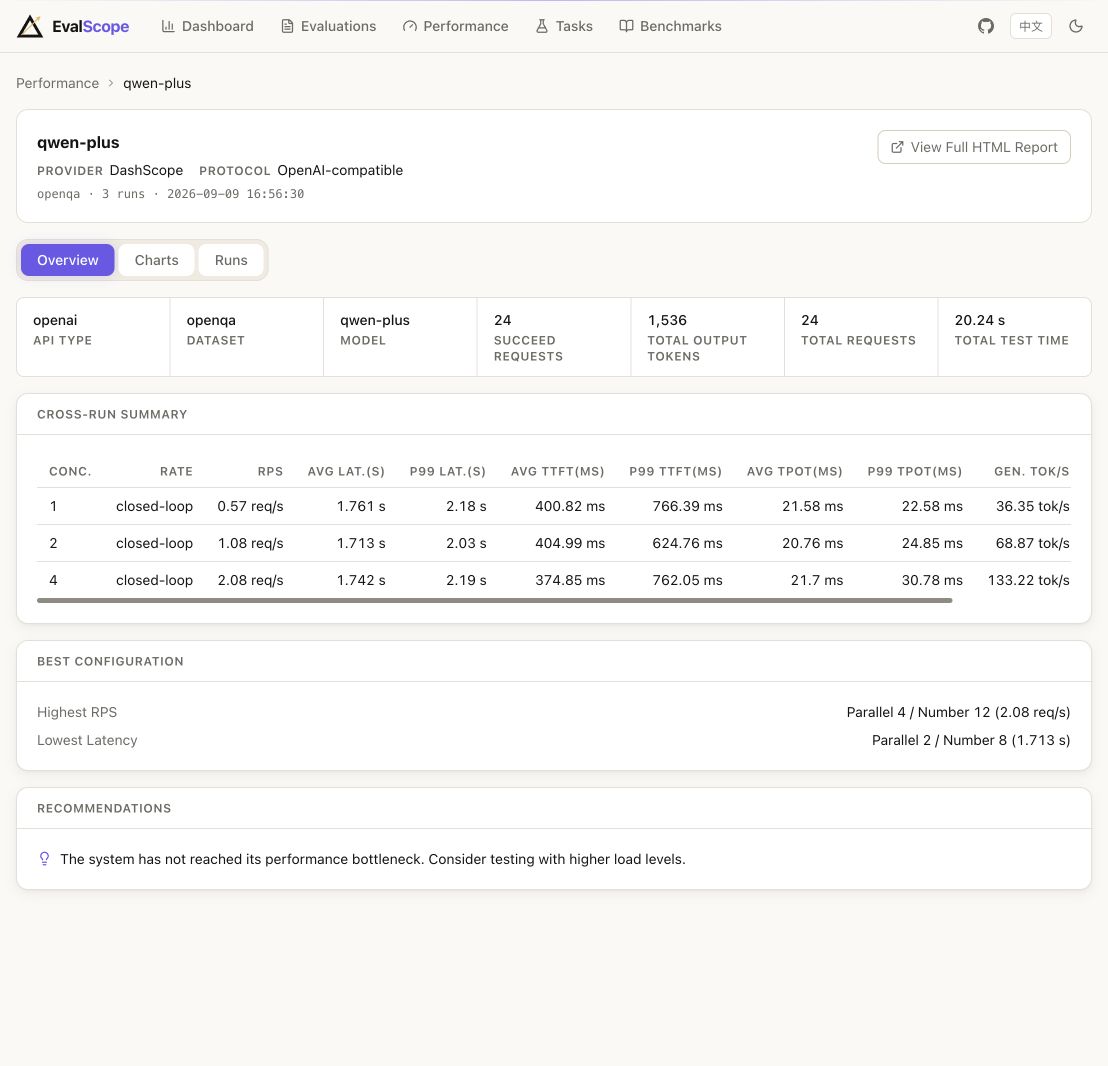
Decision-ready evidence
A performance run should explain service behavior across load, not promote one isolated number.
No model weights or GPU are required when testing a compatible API.
Run an API testevalscope perf \
--model your-model --api openai \
--url https://api.example.com/v1 \
--api-key "$MODEL_API_KEY" \
--number 24 --parallel 1 2 4