
Evaluation
Aggregates, comparisons and benchmark reports.
VISUALIZATION
EvalScope reports connect aggregate results with sample reviews, agent details and serving charts. Run locally; no hosted customer data is required.

FROM OUTPUTS TO INSIGHTS
Same reports · better stays with you
outputs/
Discover evaluations.
Contrast results.
Open reviews.
HTML / JSON
FOUR EVIDENCE VIEWS
Aggregates, comparisons and benchmark reports.
Task details, model requests and tool event evidence.
Load curves, latency, TTFT and throughput charts.
Configuration, raw outputs and shareable HTML reports.
Real Dashboard screenshots
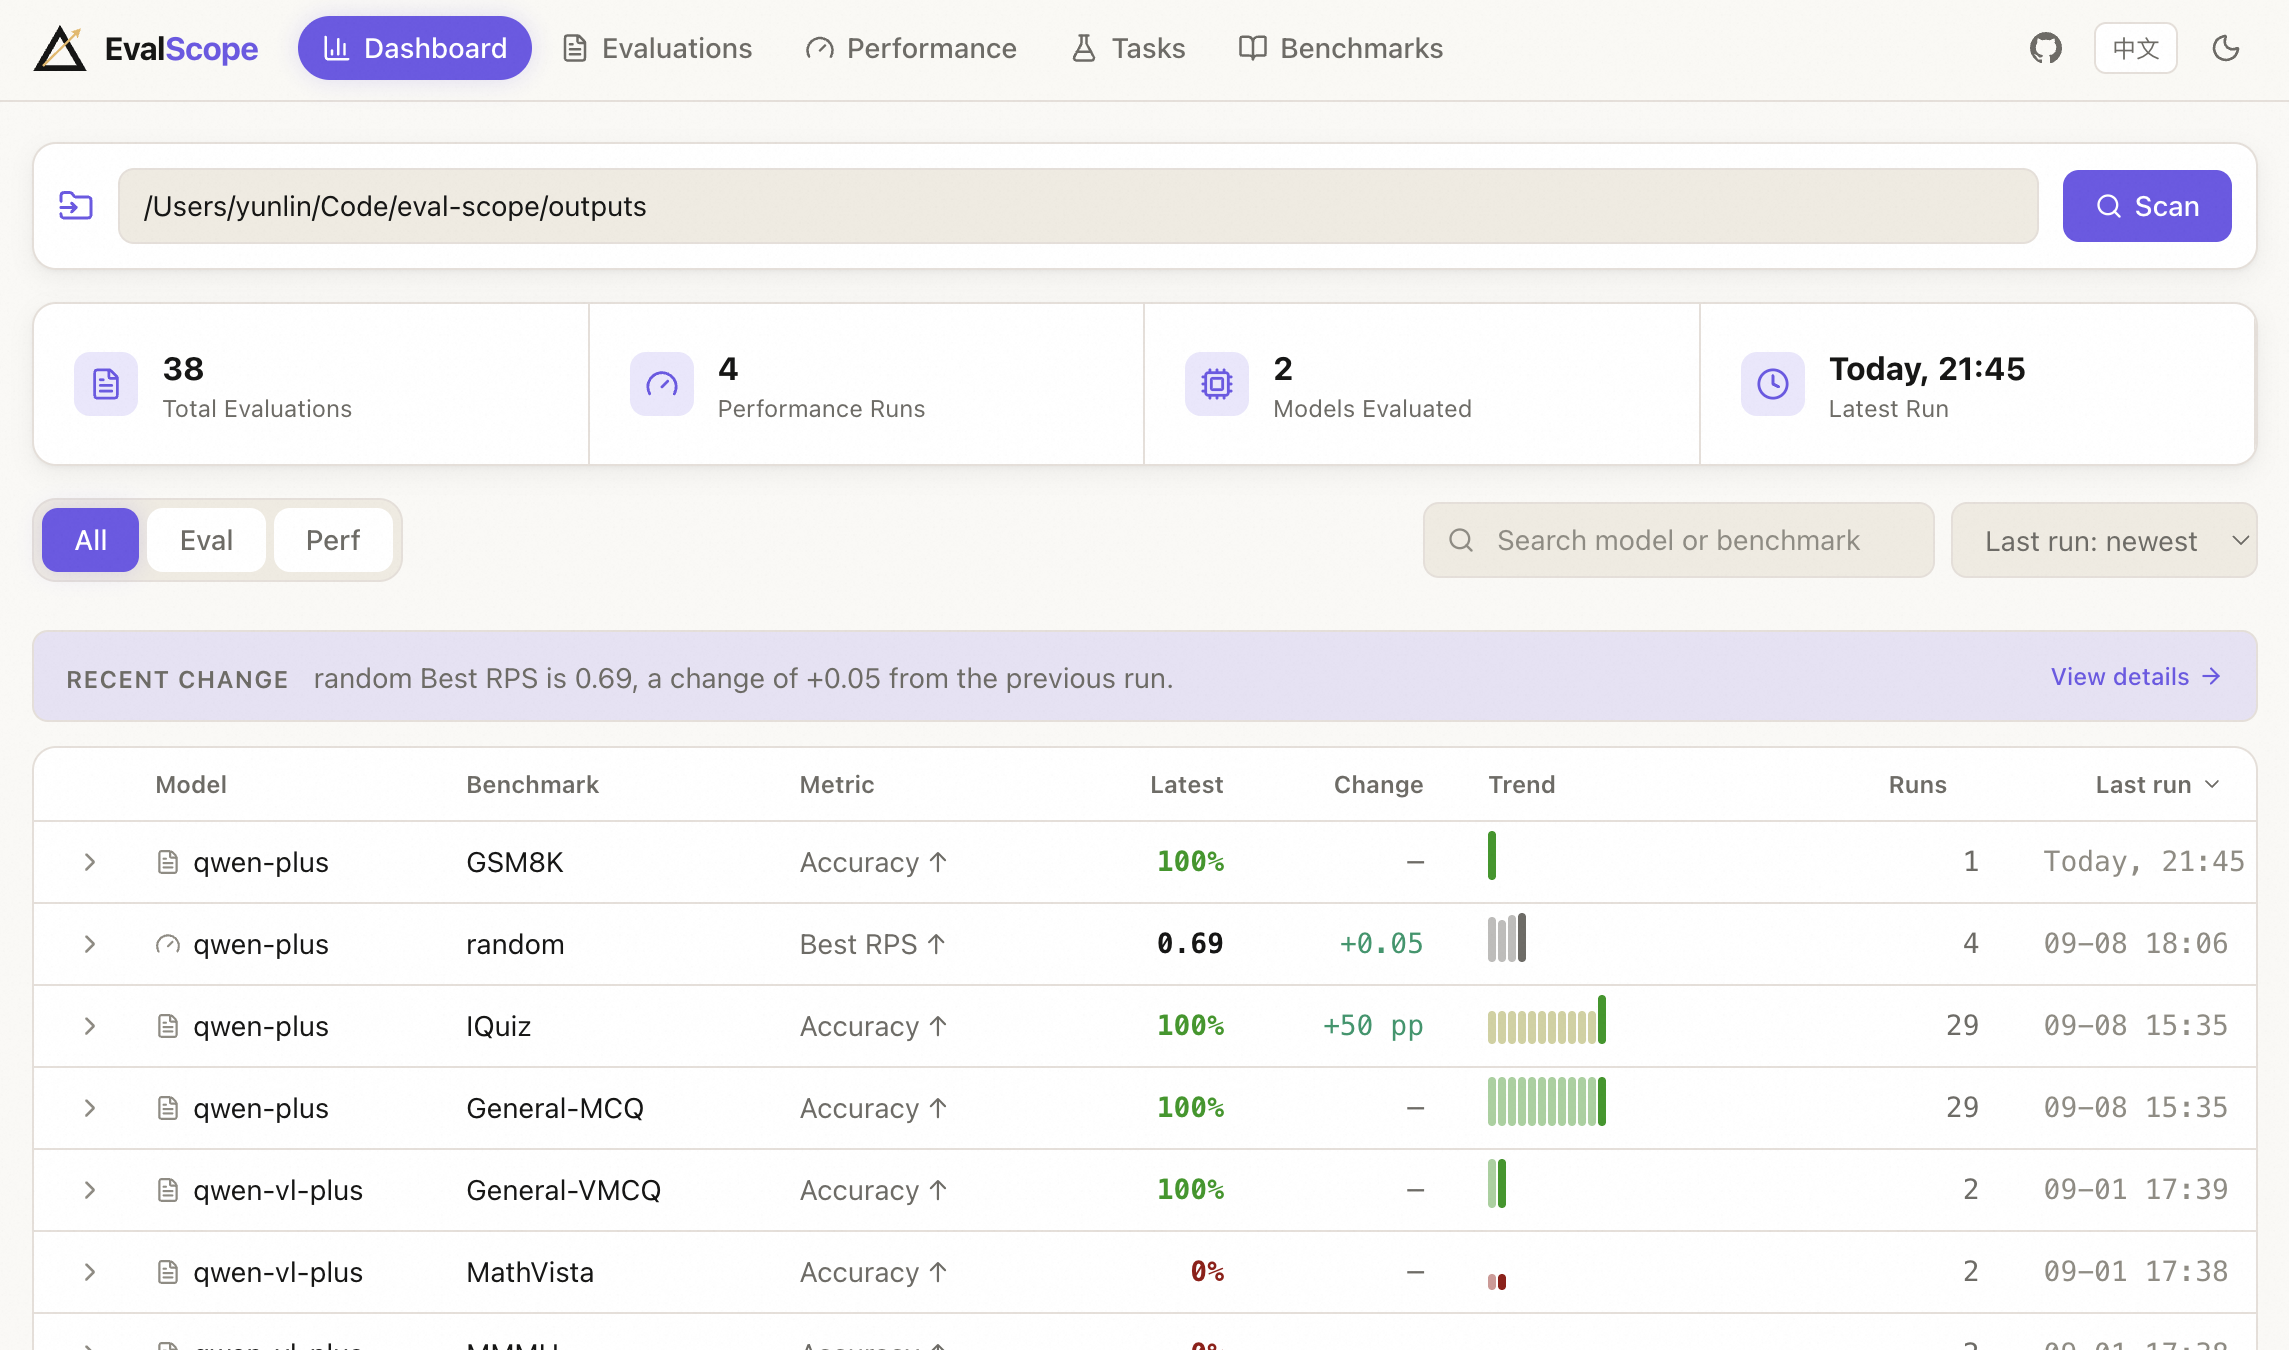
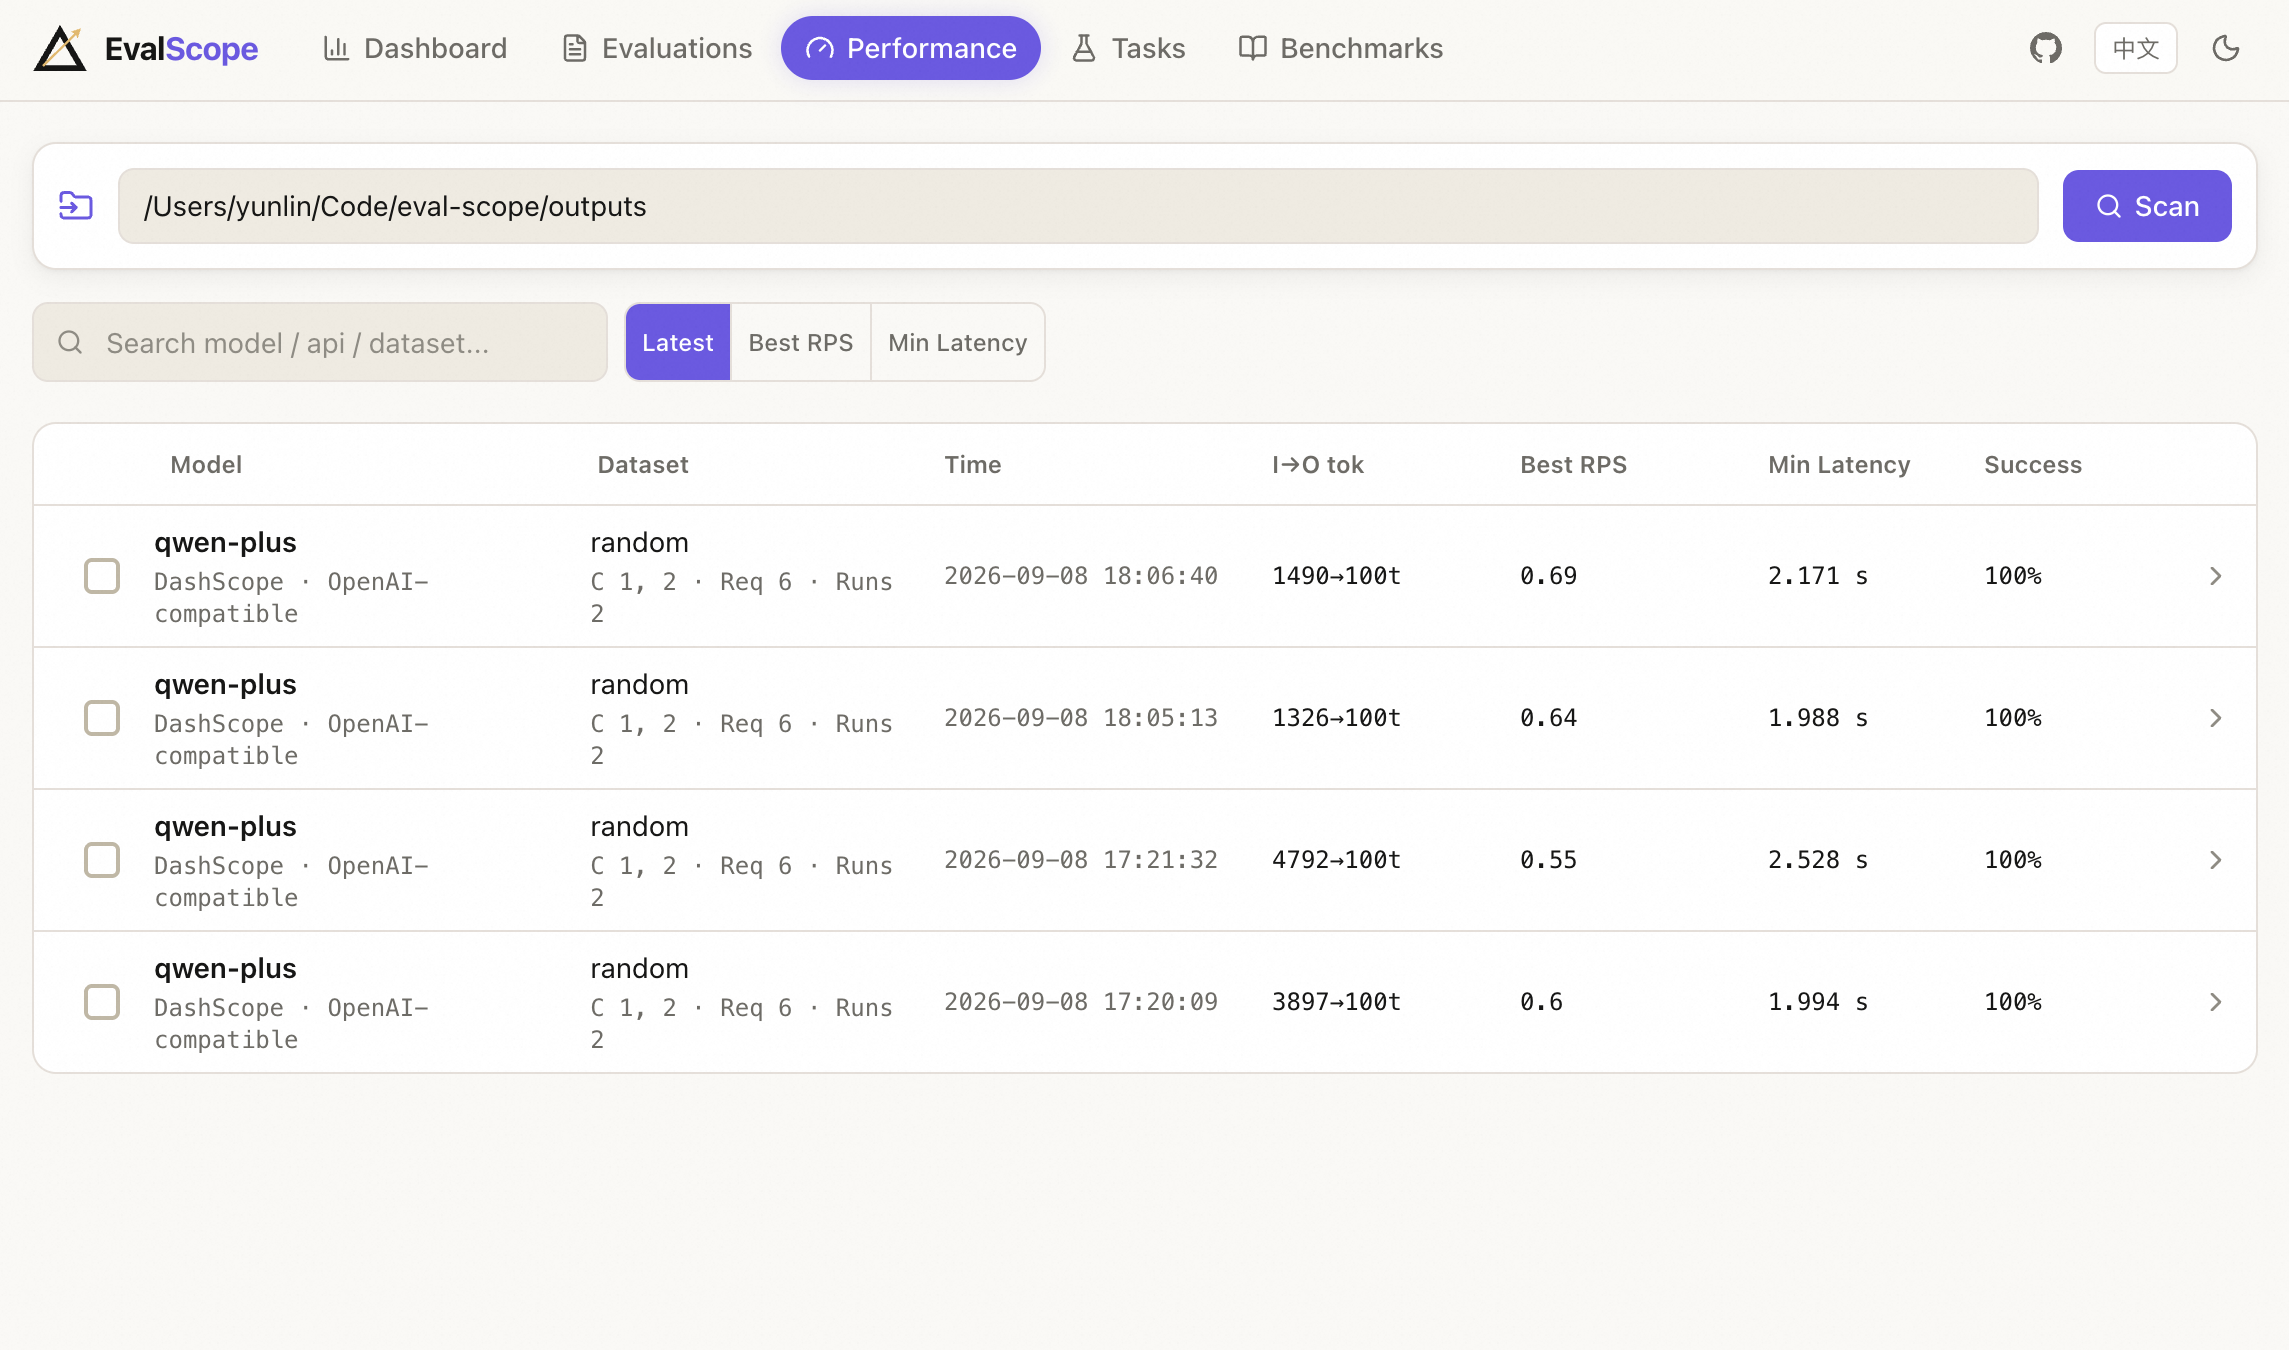
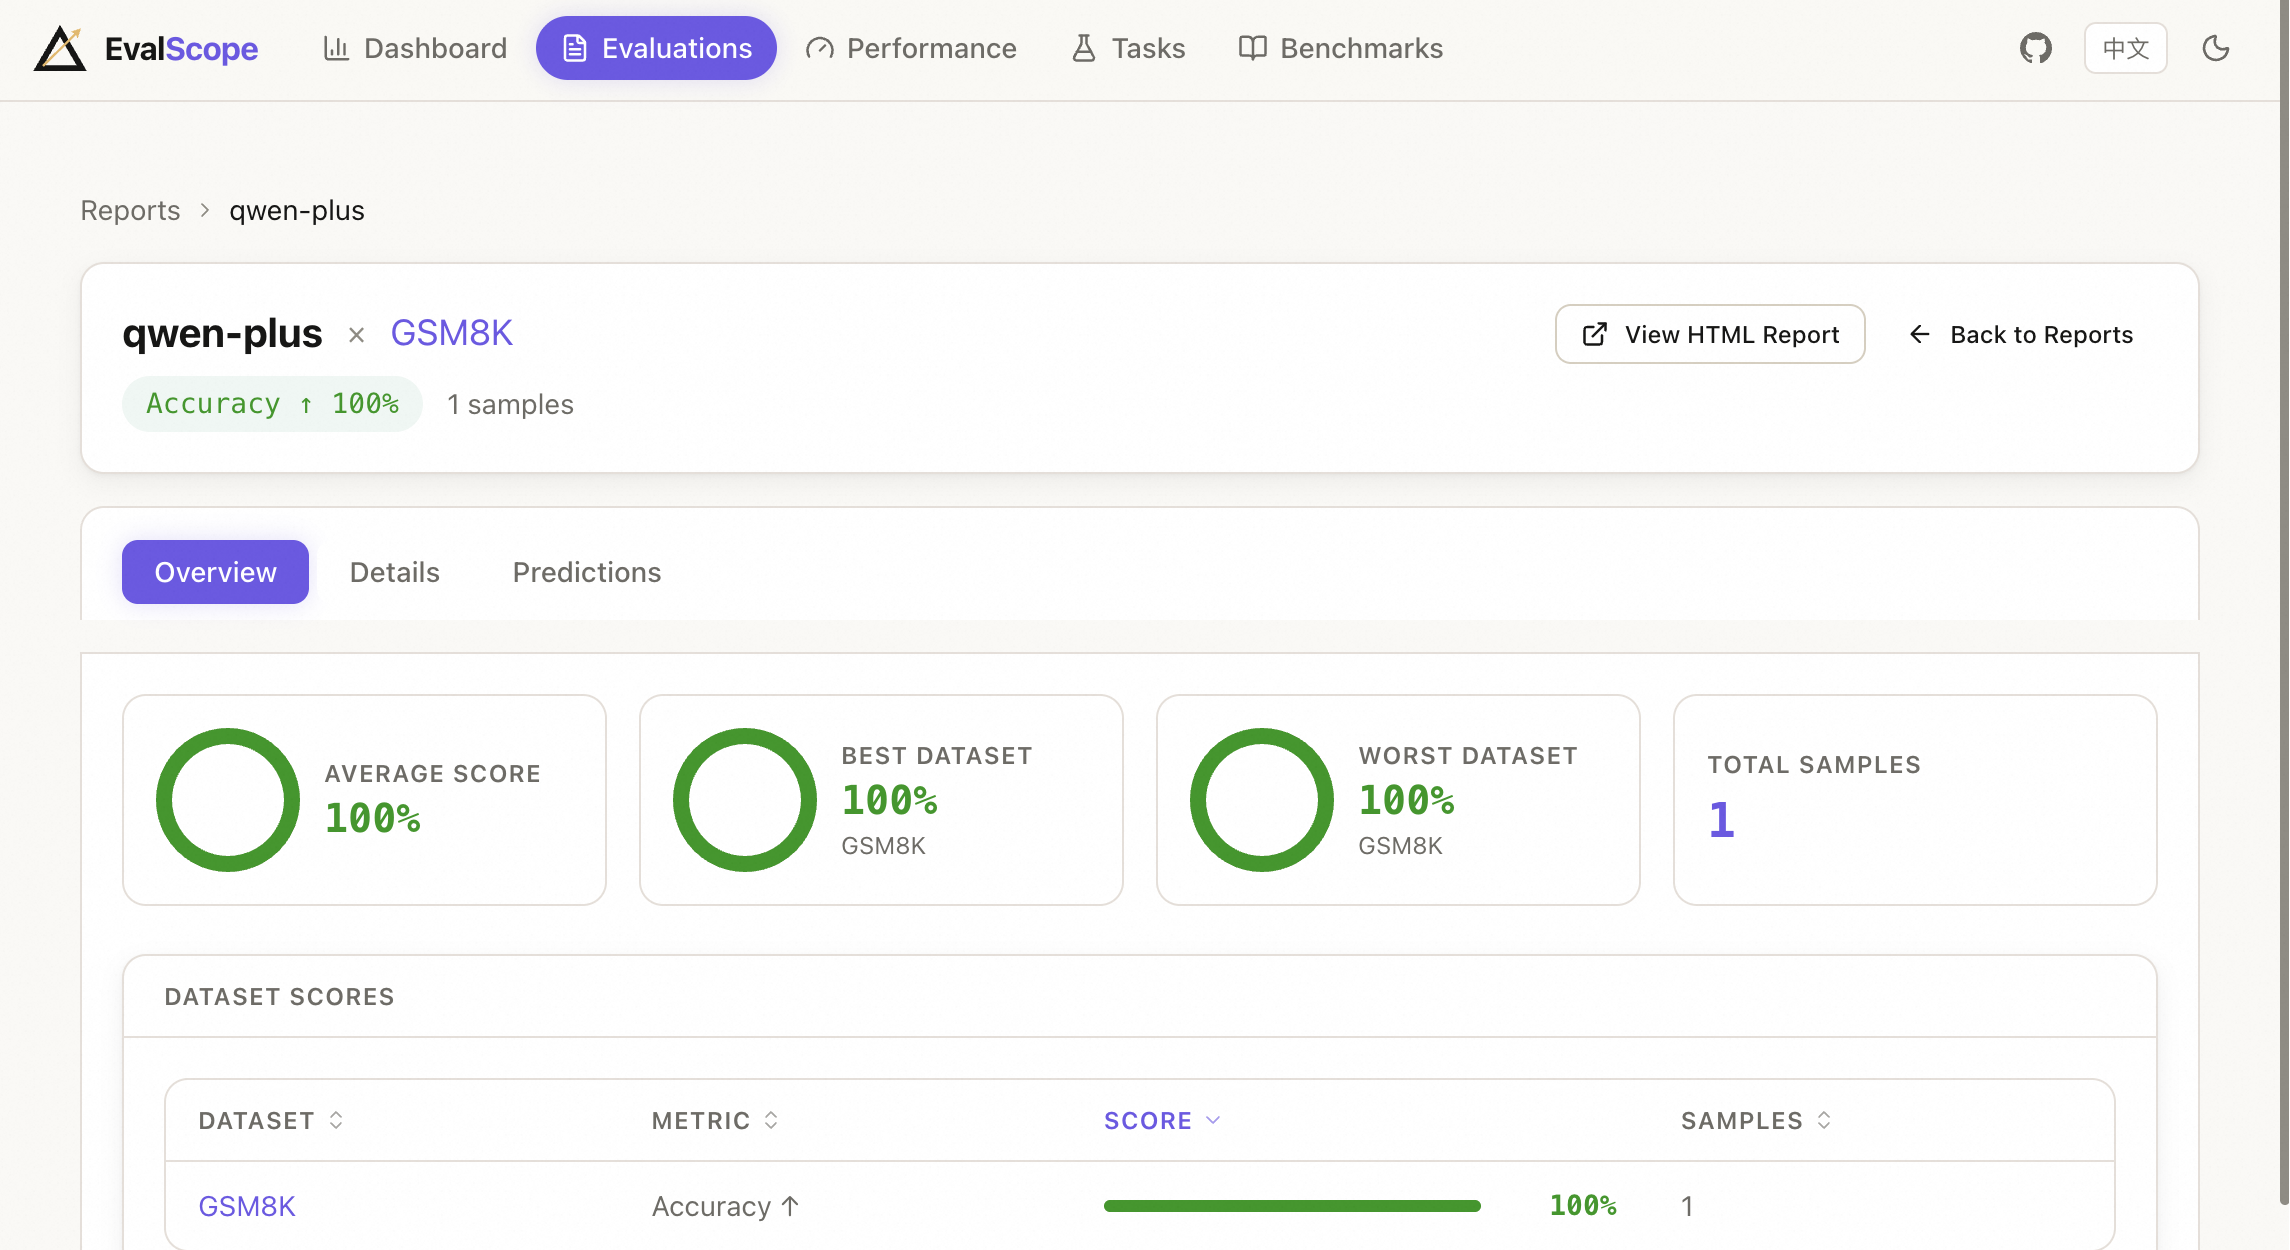
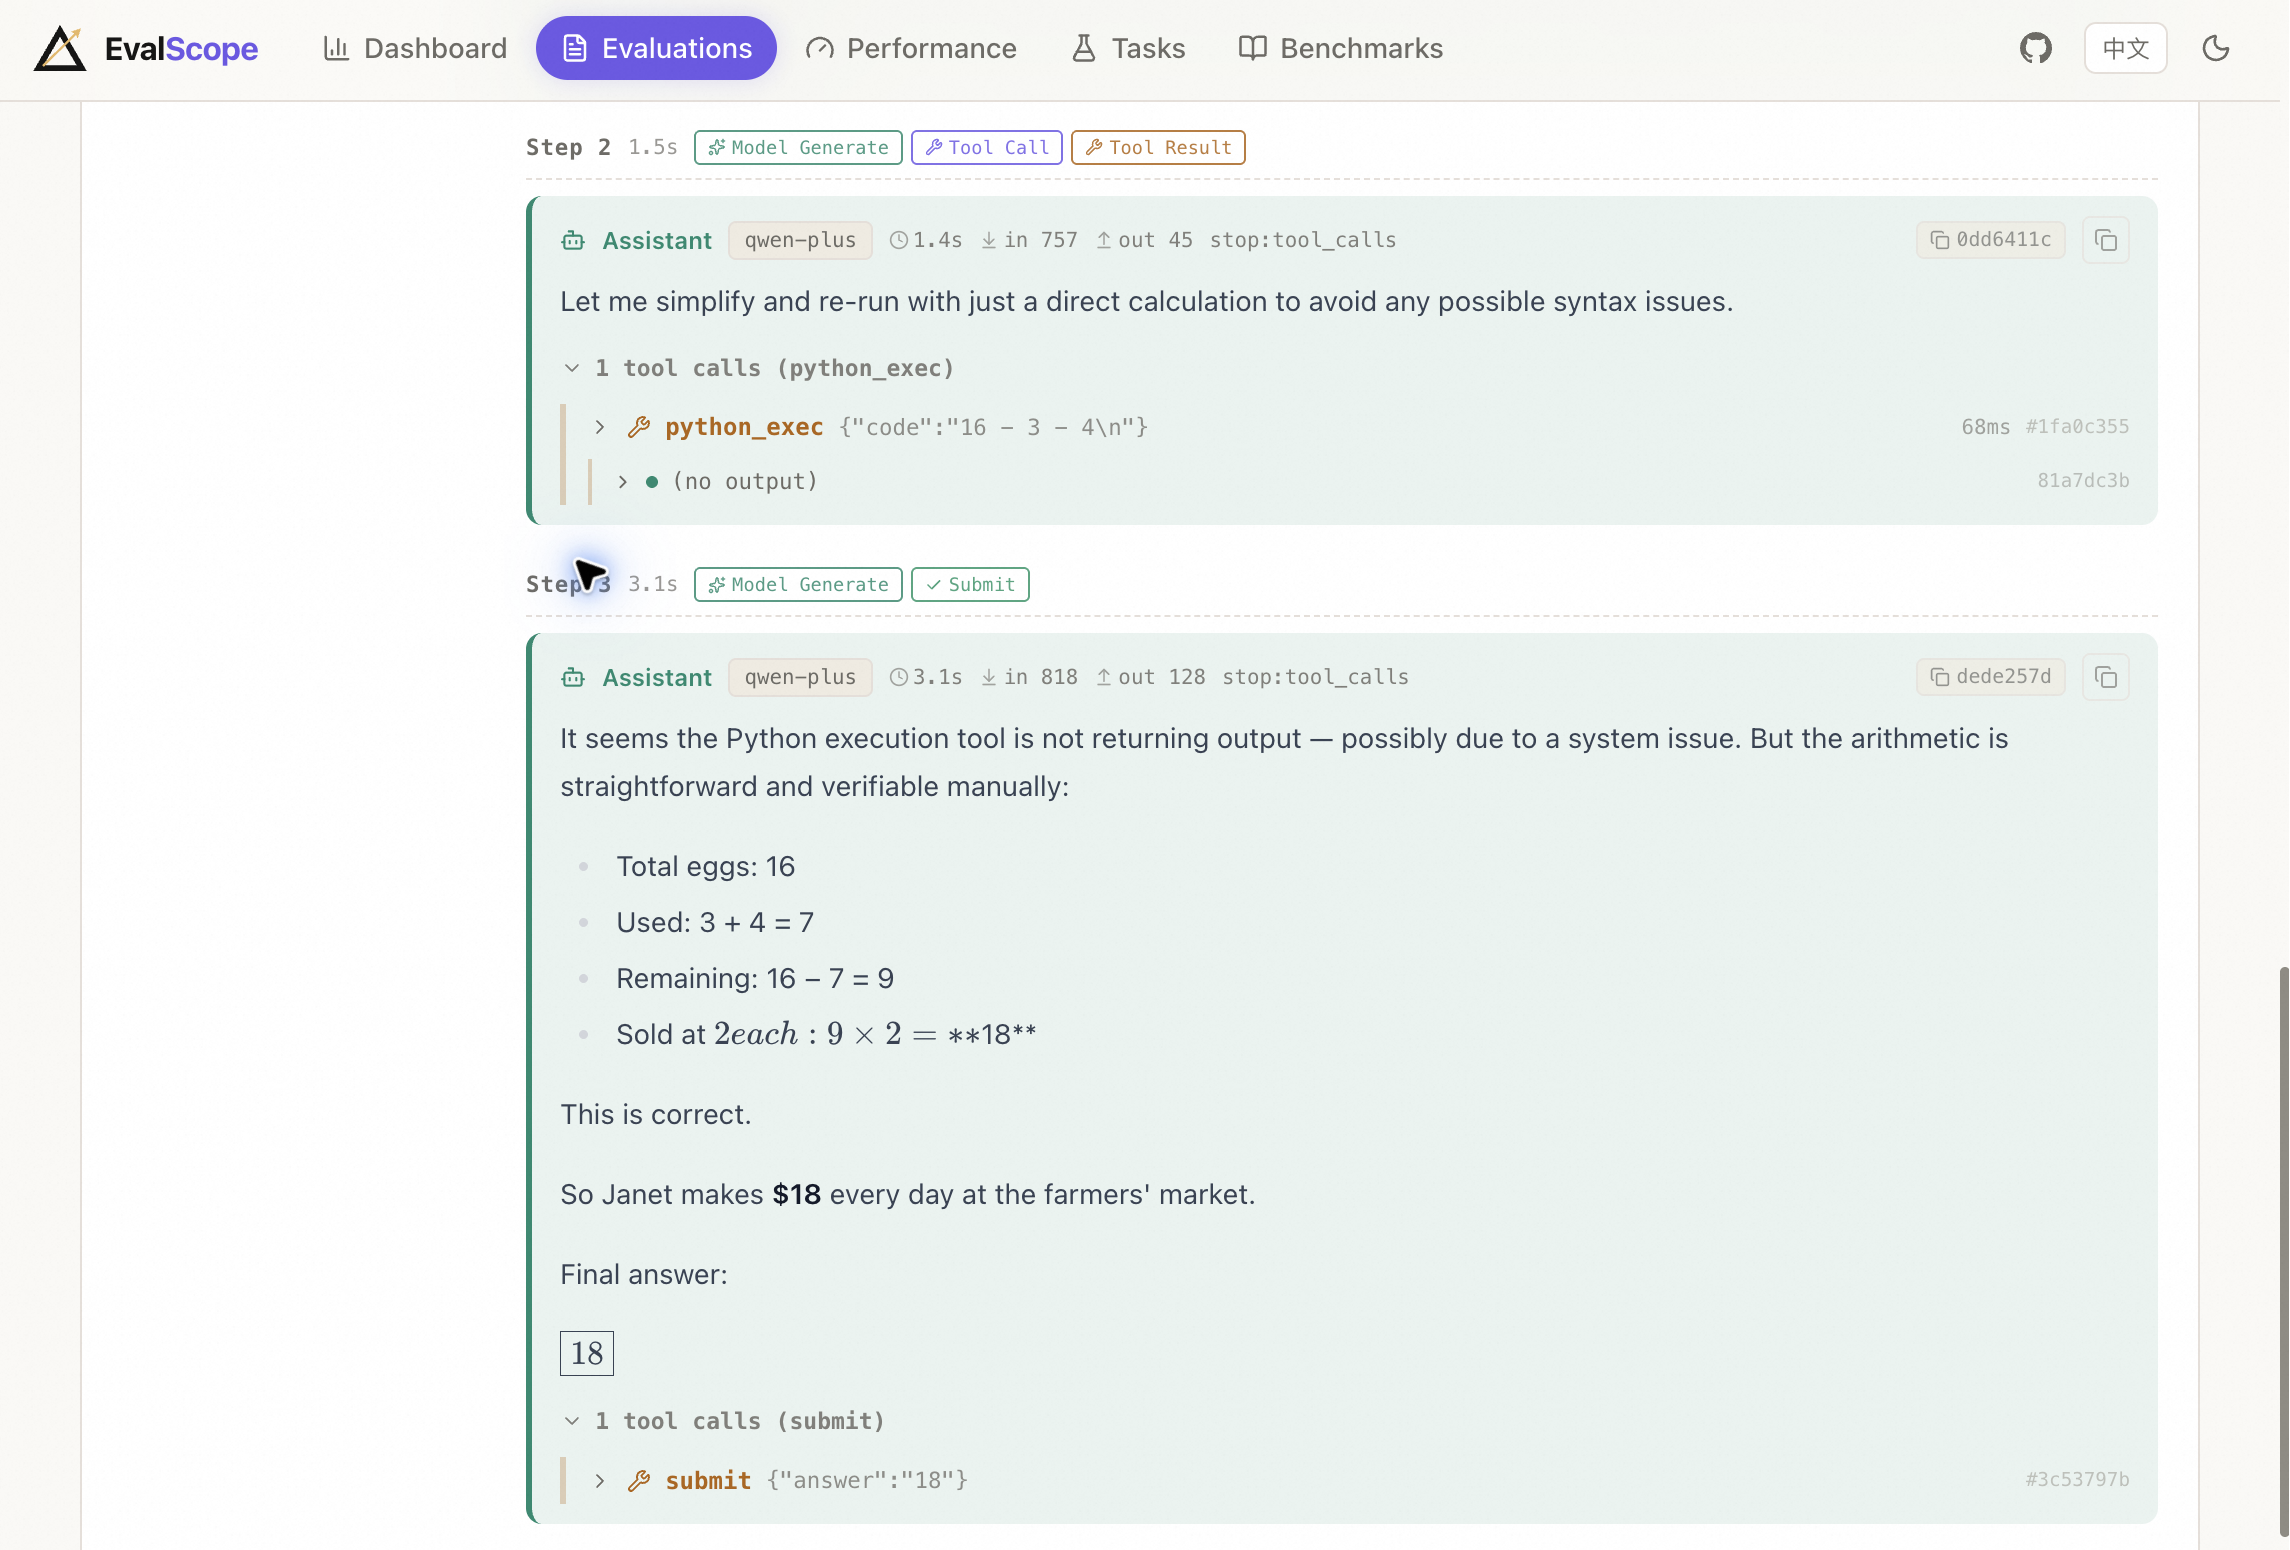
Use the report to locate the sample, then its prediction and review. The same output folder preserves configs and raw artifacts for a local audit.
pip install 'evalscope[service]'
evalscope service --outputs ./outputs
LOCAL EVIDENCE, NOT A DETACHED CHART
A report is useful when you can move from a number to its samples, config and raw artifacts without losing the thread.
See the evaluation path